Large Scale Government Users and Programs
![]()
![]()
The World Agricultural Outlook Board ("WAOB") is one of the U.S. Federal Government's largest users of remote sensing (USDA WAOB, 1998). The WAOB coordinates all remote sensing activities for the United States Department of Agriculture ("USDA") agencies. USDA agencies use remote sensing to assess crop conditions; monitor, manage and administer natural resources; and conduct remote sensing research.
The USDA provides statistical information about agriculture and rural communities through its agency the National Agricultural Statistics Service ("NASS"). The NASS conducts surveys and prepares estimates of U.S. agricultural crop production, supply inventories and agricultural production revenue and costs. Federal, State and Local governments use this information to help form public policy and legislation controlling agricultural commodity production, storage, marketing, and distribution.
The NASS has had limited success using remote sensing to assist in estimating crop yields. NASS statisticians use Landsat satellites to identify patterns in crops in order to assess crop development and progress. Problems cited by the NASS for limiting its remote sensing to only one or two states include temporal availability that doesn't allow for an adequate number of revisits and cloud cover similar to that shown in figure 3.3 that has reduced or blocked the number of useful images (NASS, 1998).
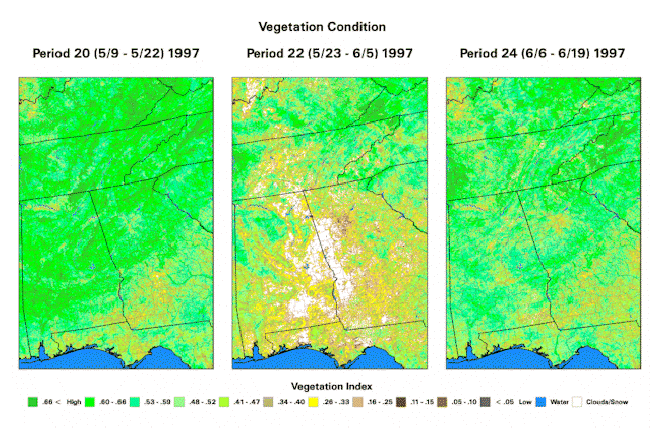
Figure 3.4 Cloud cover anomaly in center image
Every two weeks, NASS statisticians use remote sensing information from the National Oceanic and Atmospheric Administration ("NOAA") satellites and vegetation vigor indices from the U.S. Geological Survey ("USGS") to estimate crop condition. The USGS indices are based on the NOAA satellite remote sensor data. NASS compares the current year vigor indices with prior year images, using change detection postprocessing, to determine if crop development is lower, higher or the same as prior years as shown in figure 3.5. NASS has not yet been able to convert the vigor indices into specific crop yield data (NASS, 1998).
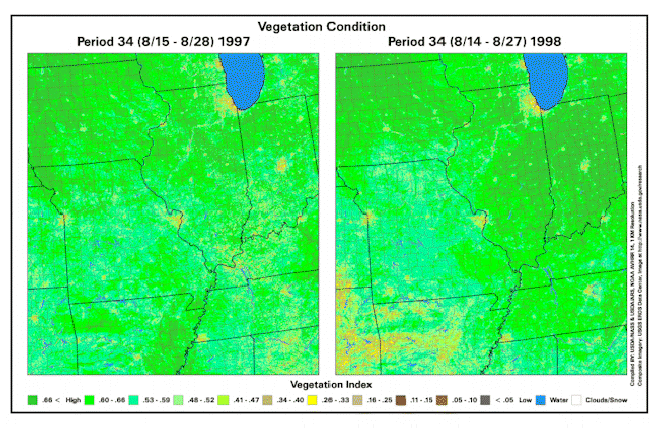
Figure 3.5 Normalized Difference Vegetation Index images.
The Foreign Agricultural Service ("FAS") collects and reports statistical information on global crop conditions and production. This USDA agency has developed crop models, which combine satellite images and weather data to estimate yield, plant growth stage, soil moisture and winterkill. The FAS analyzes over 9,500 multispectral satellite images per year (FAS, 1998).
European Commission
The European Commission ("EC") through its complex networks of associations and departments, under the EC's research affiliate the Joint Research Centre ("JRC"), controls the research activity for country members of the European Union ("EU"). The JRC program, Monitoring Agriculture with Remote Sensing ("MARS"), provides the necessary technical support and image data to EU organizations such as the Directorate General for Agriculture and the European Statistical Office. Satellite data is used to measure crop acreage, type and yield. The resulting agricultural statistical information assists the EU in monitoring member states' compliance with EU agricultural policies.